Lesson 1Does “Digital” equal “Green” ?
- Notion 1 - What´s the environmental impact of the digital world?
- Notion 2 - Sizing up Internet´s carbon emissions.
- Notion 3 - What is the environmental impact of our working habits? (devices)
- Notion 4 - What is the environmental impact of our working habits? (services)
- Notion 5 - Design is where sustainability happens.
- Notion 6 - Review of the main concepts.
Notion 2
Sizing up Internet´s carbon emissions.
Target skills
When talking about Internet´s carbon footprint, we can highlight 2 main groups of internet components that contribute to contamination:
- Visible: hardware (data centres, servers, computers and smartphones, kilometres of connecting cables), which requires manufacturing, powering and cooling ;
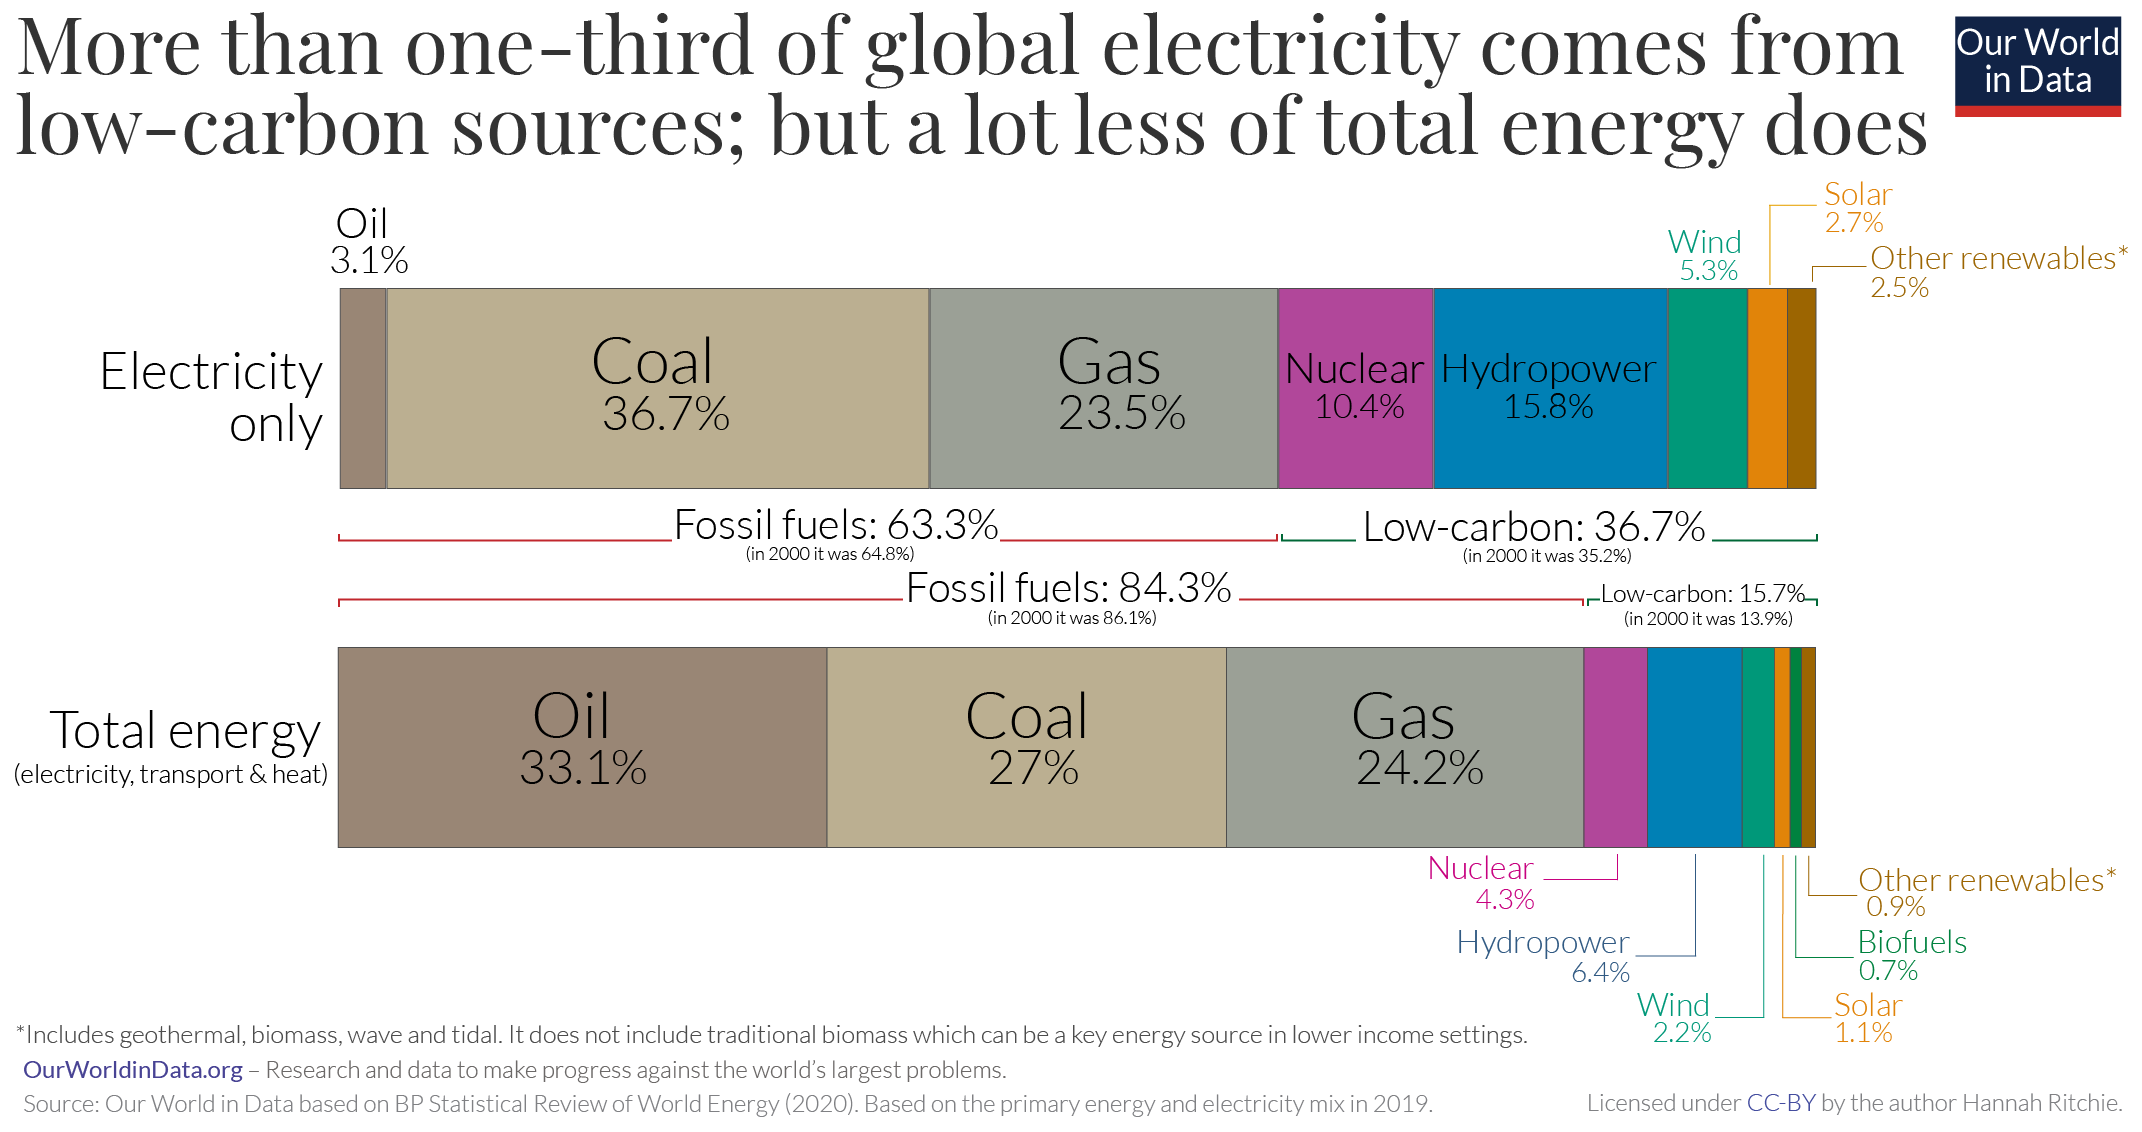
- Invisible: Internet activities (search queries, sending e-mails, video and audio streaming, social networks, e-commerce, instant messaging), as they require constant data flows and their storage. Data are stored in energy-intensive servers that are housed in huge data centres. These centres function by consuming a lot of energy including all the equipment used for cooling and maintaining the proper temperature. Electricity and energy generating in its turn produces CO2 emissions (taking into account that most of it is produced out of fossil fuels, see the infographic of energy sources).
In the last few years, distribution of energy consumption by digital technologies has changed, and the “use” (55% ) now surpasses “production” (45%) according to “Lean ICT – Towards digital sobriety” published in 2018.
The online information lives on the websites. On one side, websites are compound parts of many linked webpages. On the other side, websites also need housing, that eventually is at a datacentre. The size of the webpage is measured by its download file size. It is made up of all the files that make up the page: HTML (HyperText Markup Language - defines meaning and structure of web content), CSS (Cascading Style Sheets - language used to give a style to a webpage) , JavaScript (programming language to create interactive elements of a webpage), image files, videos and other sources. The bigger or heavier the page is, the more storage space it requires and consequently more energy which ultimately results in more CO2 emissions.
In 1994, there were 3000 websites. Currently there are 1.18 billion websites in the world (17% of those are active and 83 % are inactive). Not only their number, but also their weight has exploded: from 100 KB in 2003 to about 4 MB in 2019.
Those bytes of information on the internet are constantly increasing. It is estimated that by 2025, given the current rate of growth, the global traffic on the Internet will reach 175 zettabytes (= 10²¹ bytes). A single zettabyte can hold 36.000 of HD video.
Here is an interesting video that shows the size of bytes in perspective:
The webpages are becoming obese. Images and videos are the most to blame of a webpage's bloat. Although there are other factors that add to a page's weight such as JavaScript, poorly written code, third-party services (analytics, chat bots, forms, ads).
If we want to help save the planet, we should seriously consider putting our web pages on diet and reduce their weight.
Maciej Ceglowski (a web developer) in his talk at the Web Directions conference in Sydney, in 2015 ( https://webdirections.org/blog/the-website-obesity-crisis/ ), suggested “a food pyramid for the web”. For a balanced website in 2015 he recommended:
- A solid base of quality text formatted with a healthy dose of markup.
- Some images (in moderation) to support visual design.
- A small portion of CSS.
- At the top of the pyramid, a very scarce and only if needed, JavaScript.
