Notion 94
Browser – How to use it as an evaluation tool
Target skills
Modern web browsers have embedded tools to evaluate the behaviour of a website. These tools are generally used by developers to test and tweak their website. To see those tabs, you can right click on a page and click on "Inspect". We can find several tabs in it:
Network tab
It is possible to see requests made by the browser to the website and other servers.
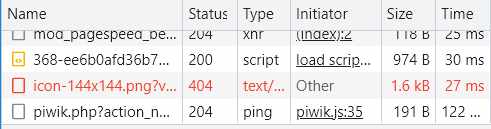
Image description: Screenshot of the "Networks" tab where it can be seen that a PNG image on the inspected site weighs 1.6 kilobytes and has a loading time of 27 milliseconds.
It is possible to see the weight of each request and the destination, which can be useful to track any problem or heavy data.
Performances tab
The different steps of loading a webpage have various lengths. This tab is useful to see which step is taking time.
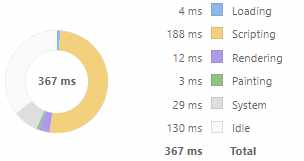
Image description: Screenshot of the "Performance" tab where we can see that the inspected page took 367 seconds to load all its elements.
The above image shows that for The Good Manager website, Scripting is the longest step for render (188 milliseconds out of 367).
Storage tab
Also called Application, this section gathers all the data saved client-side, on the browser, for the website to work properly.
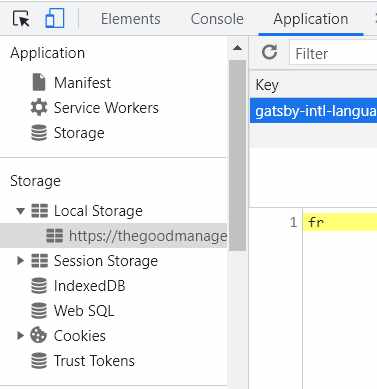
Image description: Screenshot of the "Storage" tab where you can see the different types of storage used on the page inspected.
It can be cookies or local storage. It can be used to know if the website uses tracker and collects information on the visitors.
To go further:
- Learn to use Chrome Dev tools: https://developer.chrome.com/docs/devtools/open/
- Learn to use Firefox Dev tools: